I have been following the COVID case numbers on the Maryland COVID Dashboard for a while, but began following it a bit more closely in August when it was announced the dashboard would begin to include vaccination breakthrough case data. If you would like to read the press release announcing it, you can do so here.
Apparently, there was some type of Cyber Attack and the numbers stopped updating for about 2 weeks in December but luckily they began updating again the day after double vaccinated and boosted Governor Hogan announced he had tested positive for COVID.
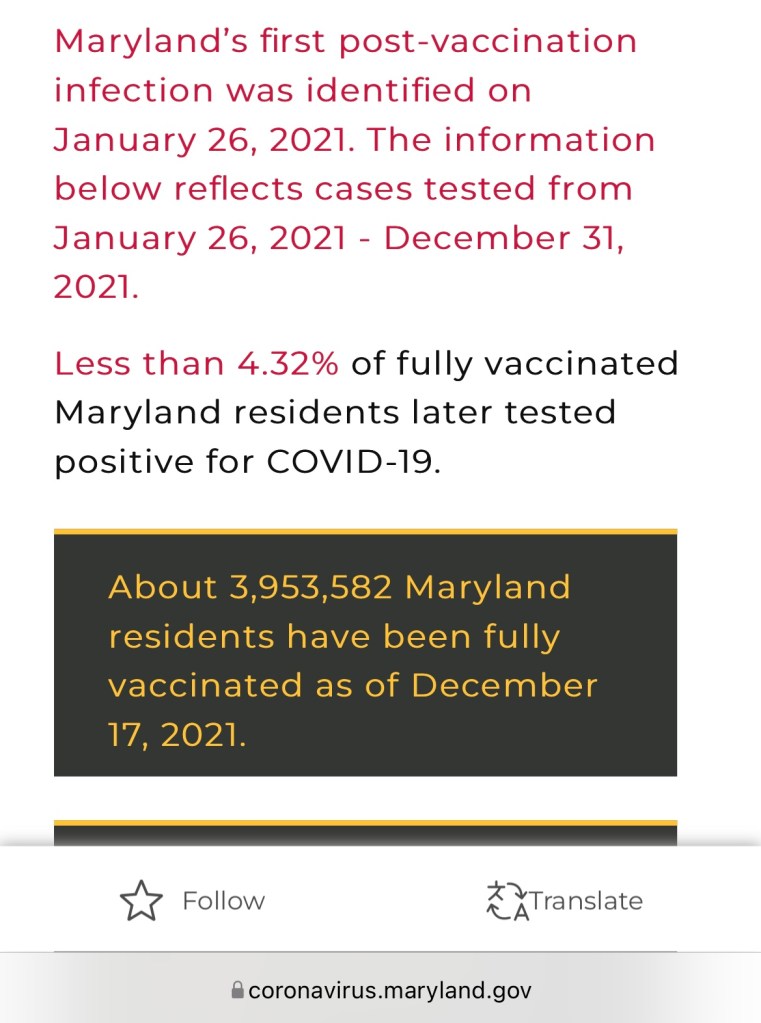
Anyway, there are two handy bar graphs detailing monthly data from January 26th, 2021 – November 30th, 2021 for vaccinated COVID positive cases. Although they have not been updated since November, you can still gather the data for total monthly cases and hospitalizations for COVID cases in vaccinated individuals. Although we are nearing the middle of January, December data is not included. However, there is an updated number for total vaccinated breakthrough cases included near the bottom of the dashboard which updated today for total breakthrough cases January 26th 2021 – December 31,2021. I am including screenshots for reference.
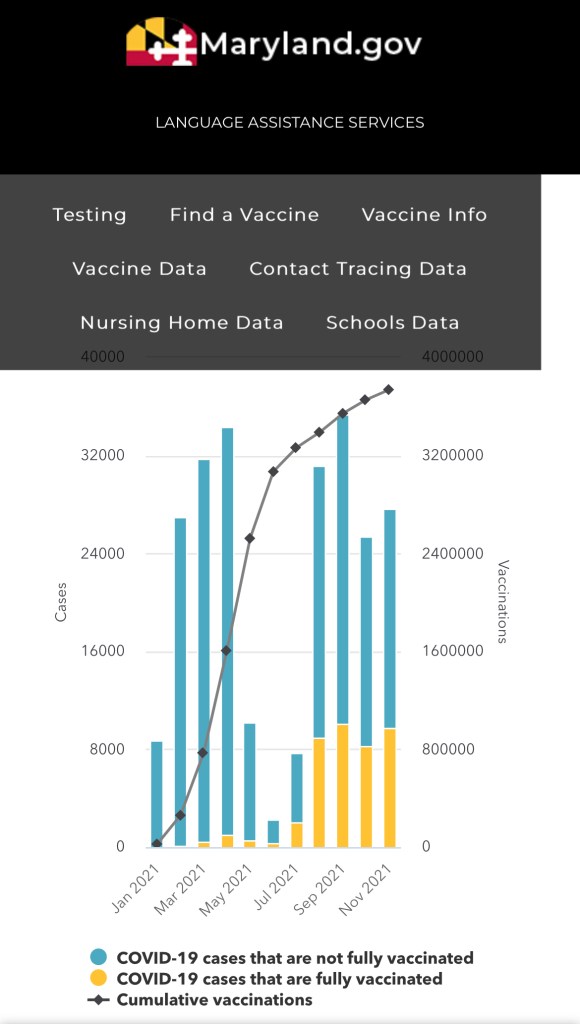

Clicking on each month in the bar graph, reveals the total monthly breakthrough case numbers and they are as follows:
January 2021 – 4
February 2021 – 73
March 2021 – 416
April 2021 – 971
May 2021 – 595
June 2021 – 316
July 2021 – 2,028
August 2021 – 8,920
September 2021 – 10,116
October 2021 – 8,318
November 2021 – 9,725
Upon adding up all of these numbers, one can arrive at a total breakthrough case number for January 2021 – November 2021 of 41,482 vaccinated COVID positive cases.
As of today, the Maryland Covid Dashboard lists 170,976 total vaccinated COVID positive cases for January 2021 – December 31, 2021.
One can deduce by subtracting 41,482 (total Jan-Nov 2021) from 170,976 (total Jan-Dec 2021) that the total vaccinated COVID positive cases for the month of December 2021 equals 129,494.
Included on the Maryland Covid Dashboard is another bar graph which details the daily case count for each day. I am providing a screenshot this also for reference. I would assume daily numbers reported are for the day previous, as they are updated around 10am each day. Therefore, when adding the daily case count numbers for December, I chose to use the dates of December 2, 2021 – January 1, 2022. When adding the daily case count for those dates together, the total case count for all of Maryland, regardless of vaccination status is 138,803 for the month of December.

Based off the information provided by the state of Maryland on the MD Covid Dashboard, the total number of UNVACCINATED COVID positive cases for the month of December is 9,309 and the total number of VACCINATED COVID positive cases for the month of December is 129,494. In other terms, 6.7% of cases in December were unvaccinated and 93.4% of cases were VACCINATED. Wild, right? Even wilder, is that not one local media outlet or government official is announcing it.
I tried to understand the hospitalization data but it is not quite as easy to decipher. While the MD COVID Dashboard does list the total hospitalizations of vaccinated COVID positive cases, it only details a daily hospitalization number overall. I would imagine someone in the hospital for more than one day is counted each day they remain hospitalized, therefore, I am not sure how to extract the numbers to understand them properly. But let’s be honest, if the numbers showed it was mostly unvaccinated cases being hospitalized, it would not only be included but would be quoted by every news outlet and leader in this state, every day. It is being left out for a reason and that should tell us all something.
Look, I am not here to prove that vaccinations are not working or that people shouldn’t be vaccinated. I am simply here to stand up for my family and others like us that can see when things are not adding up. Data is being omitted and hidden and we need ask ourselves, why? I have found over the past two years that I learn much more by paying attention to what is not being said rather than what is being said from the microphone.
However, when we have schools and businesses implementing separate rules and policies for those vaccinated vs unvaccinated and leaders blaming the return of mask mandates on unvaccinated citizens, it would seem of extreme importance to fully understand our current COVID environment through the data available.
I am not a mathematician. In all honesty, math is not my strong suit; but I am able to perform the simple math required to arrive at these numbers. The question is, why haven’t our leaders? They either believe omission relieves them of liability and guilt, they are lying or they are incompetent. In any of these cases, I do not want them leading me or my family.
Ask questions. Demand answers. And for the love of God, just be kind to one another.
A person’s true character can be revealed by whether they are willing to fight for those with whom they disagree.
It is time we begin to ask questions in unison.
Read Part 2 – here

It would be helpful to show the vaccination rate of Maryland. The ones favoring vaccine mandates will point out that the number in each camp (vaccinated/unvaccinated) who test positive is proportional to the number of each camp in society. So, if 95% are vaccinated we would expect to see the rate of cases be 95% from vaccinated and 5% from unvaccinated, likewise the hospitalization rate to be 95% from the vaccinated and 5% from the unvaccinated.
If this is too simple for real life virology then make the calculations more realistic, but the idea is sound: A larger population should produce a larger number of positives & hospitalizations & deaths.
Thank you.
LikeLiked by 1 person